With the rise of computational power, and the gradual maturation of the analytics industry, everyone’s really excited about predictive analytics.
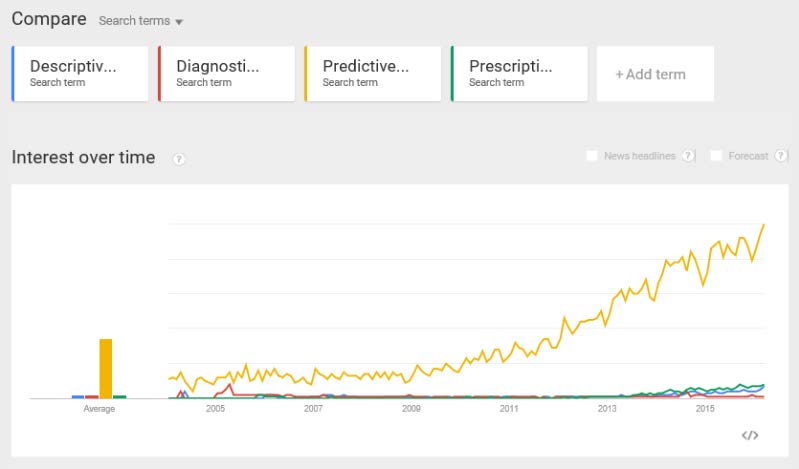
What you don’t hear a lot about in the articles on “How Predictive Analytics is Disrupting the Cloud” or “How to Predict How Much Data You Have” (titles obfuscated to protect the innocent), are the other analytical phases (Descriptive, Diagnostic, and Prescriptive), as evidenced by the Google Trends query and visualization below:
In this post, we’re going to delve deeper into descriptive analytics, a necessary phase of the analytical journey which can take some organizations years to get right before they will be ready for predictive analytics.
Definition
Descriptive analytics is the first and most basic tier of analytics, in which historical data is aggregated, summarized, and visualized. In essence, descriptive analytics answer the question: “What happened?” Below is an example of descriptive analytics from an environment that relates to volume. This could entail sales numbers, customer support tickets, production numbers, etc.
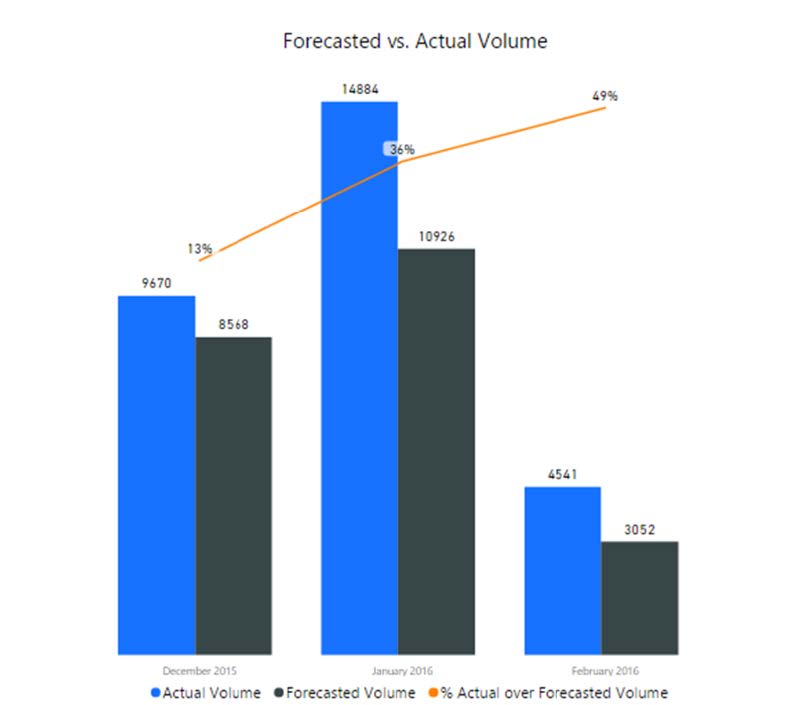
This visualization gives us the forecasted volume and actual volume aggregated by month, with a calculation of the percentage that the actual volume came in above the forecast.
When presented with a visualization similar to the above, managers and stakeholders begin asking follow-up questions: why did this happen? Do we know if it’s going to happen again this month? Can we see the trends for the past year? What are we going to do about it?
These are important questions-the answers to which require the application of multiple analytical techniques (several of which will be addressed in future posts). The important note here is that the descriptive stage of the analytical process is the catalyst for the next series of analyses.
Approaching Descriptive Analytics
Start with a balanced team
If your organization or team has enough budget for, say, three resources to create an analytics solution, where should you start? The current buzz around “data scientists” might lead one to believe it best to hire three data scientists, give them access to your data, and wait for the insights to pour into your organization.
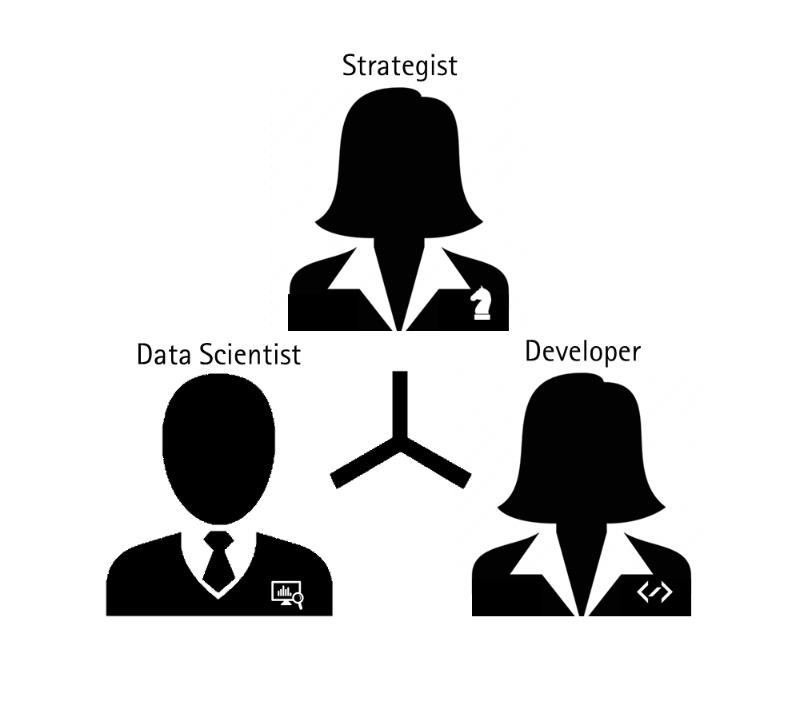
While a team consisting of only data scientists will absolutely provide insights, building a balanced team ensures the relevancy and scalability of insights produced. A strategist (someone with domain or overall business strategy expertise) will ensure that the insights are relevant (i.e. satisfy the business need). A developer (whose role will vary greatly depending on your data source(s), how many end users you have, and what tools you are using) will ensure the insights are scalable and timely.
A data scientist will build the insights and ensure that they are statistically correct.
There are nearly as many variations of this team and ratio as there are analytics projects. The key is to make sure your team has a balanced approach and that the right number of team members are responsible for each of the roles.
Ask the right questions
A single dataset can be analyzed and visualized in a surprisingly diverse number of ways. Because of this, it is easy to answer a question that is not being asked, or to create a visualization that, while statistically accurate, does not fully answer the business question at hand. The principle responsibility of the analytics team is to ensure they understand and anchor any report against the key questions the relevant business owners need answered, which, at times, is different than the questions the business owners ask the analytics team to answer.
Meet Jill, a business manager at a software company, who has just been asked by a product owner whether a new marketing push is needed for a given product. To help answer this question, Jill decides to ask the analytics team how many times that product is downloaded per hour of the day. If the analytics team fulfilled the request without further clarification, however, Jill would quickly realize that this graph does not at all help her to decide if a marketing push is needed (see below).
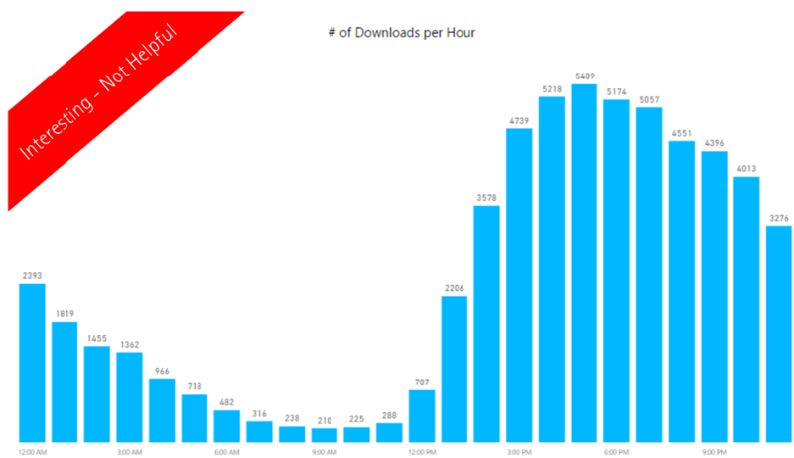
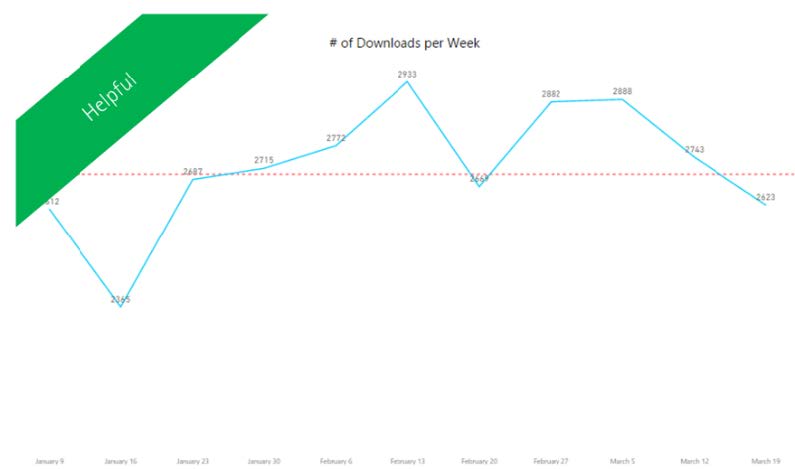
If the team instead understood the underlying question (“Do we need a marketing push for this product”), they could work with Jill to create a relevant analysis such as a trending graph of the number of downloads per week for the past 12 weeks (with 2700 downloads/week as a goal/reference line), Jill could then get an idea for how the product is increasing or decreasing in popularity, and make her recommendation.
The onus in this situation is on the business owners and the analytics team to ensure any analysis or solution is anchored on the fundamental question it is meant to address.
- Make the move from “handmade” to automated analytics (but only where the relevant business decision is an ongoing decision)
The number of analyses and reports that are generated, from scratch, each day/week/month is staggering. The labor costs and margin for error in this model far outweigh the price of investing to automate. Within the current technological landscape, automation is key to staying competitive. While making this transition, however, it is important to only automate that for which there is an ongoing question that needs to be answered.
On my first analytics project, as questions would pour in from my managers, I was proud of how quickly I could create an automated answer. A manager would ask me a question such as “How many times does x product appear in twitter posts?” and I would write the queries, build the visualizations, and add a new page to our analytics platform that would answer that question for him. Ever after, the platform would be updated each day with the new data.
In today’s pace of business, however, it is neither feasible, nor valuable to automate every report or analysis. Some analyses are needed for a single decision point, after which they can be archived. The key is to ensure that you understand whether an analysis is required for a single decision point, or if it will need to be reviewed on an ongoing basis before you begin building your report, then allocate your time and resources accordingly.
Conclusion
For the sake of brevity, I shall end here. The questions to ask yourself and your teams are: how well is your analytics team balanced? Are there enough resources focused on anchoring to business results, on building scalable solutions, and on ensuring accuracy and consistency? Is your team’s process committed, with laser-like precision, to only answering the right questions? Lastly – how many of your team’s ongoing reports could be automated? How many hours per week would your team get back if those reports were automated?